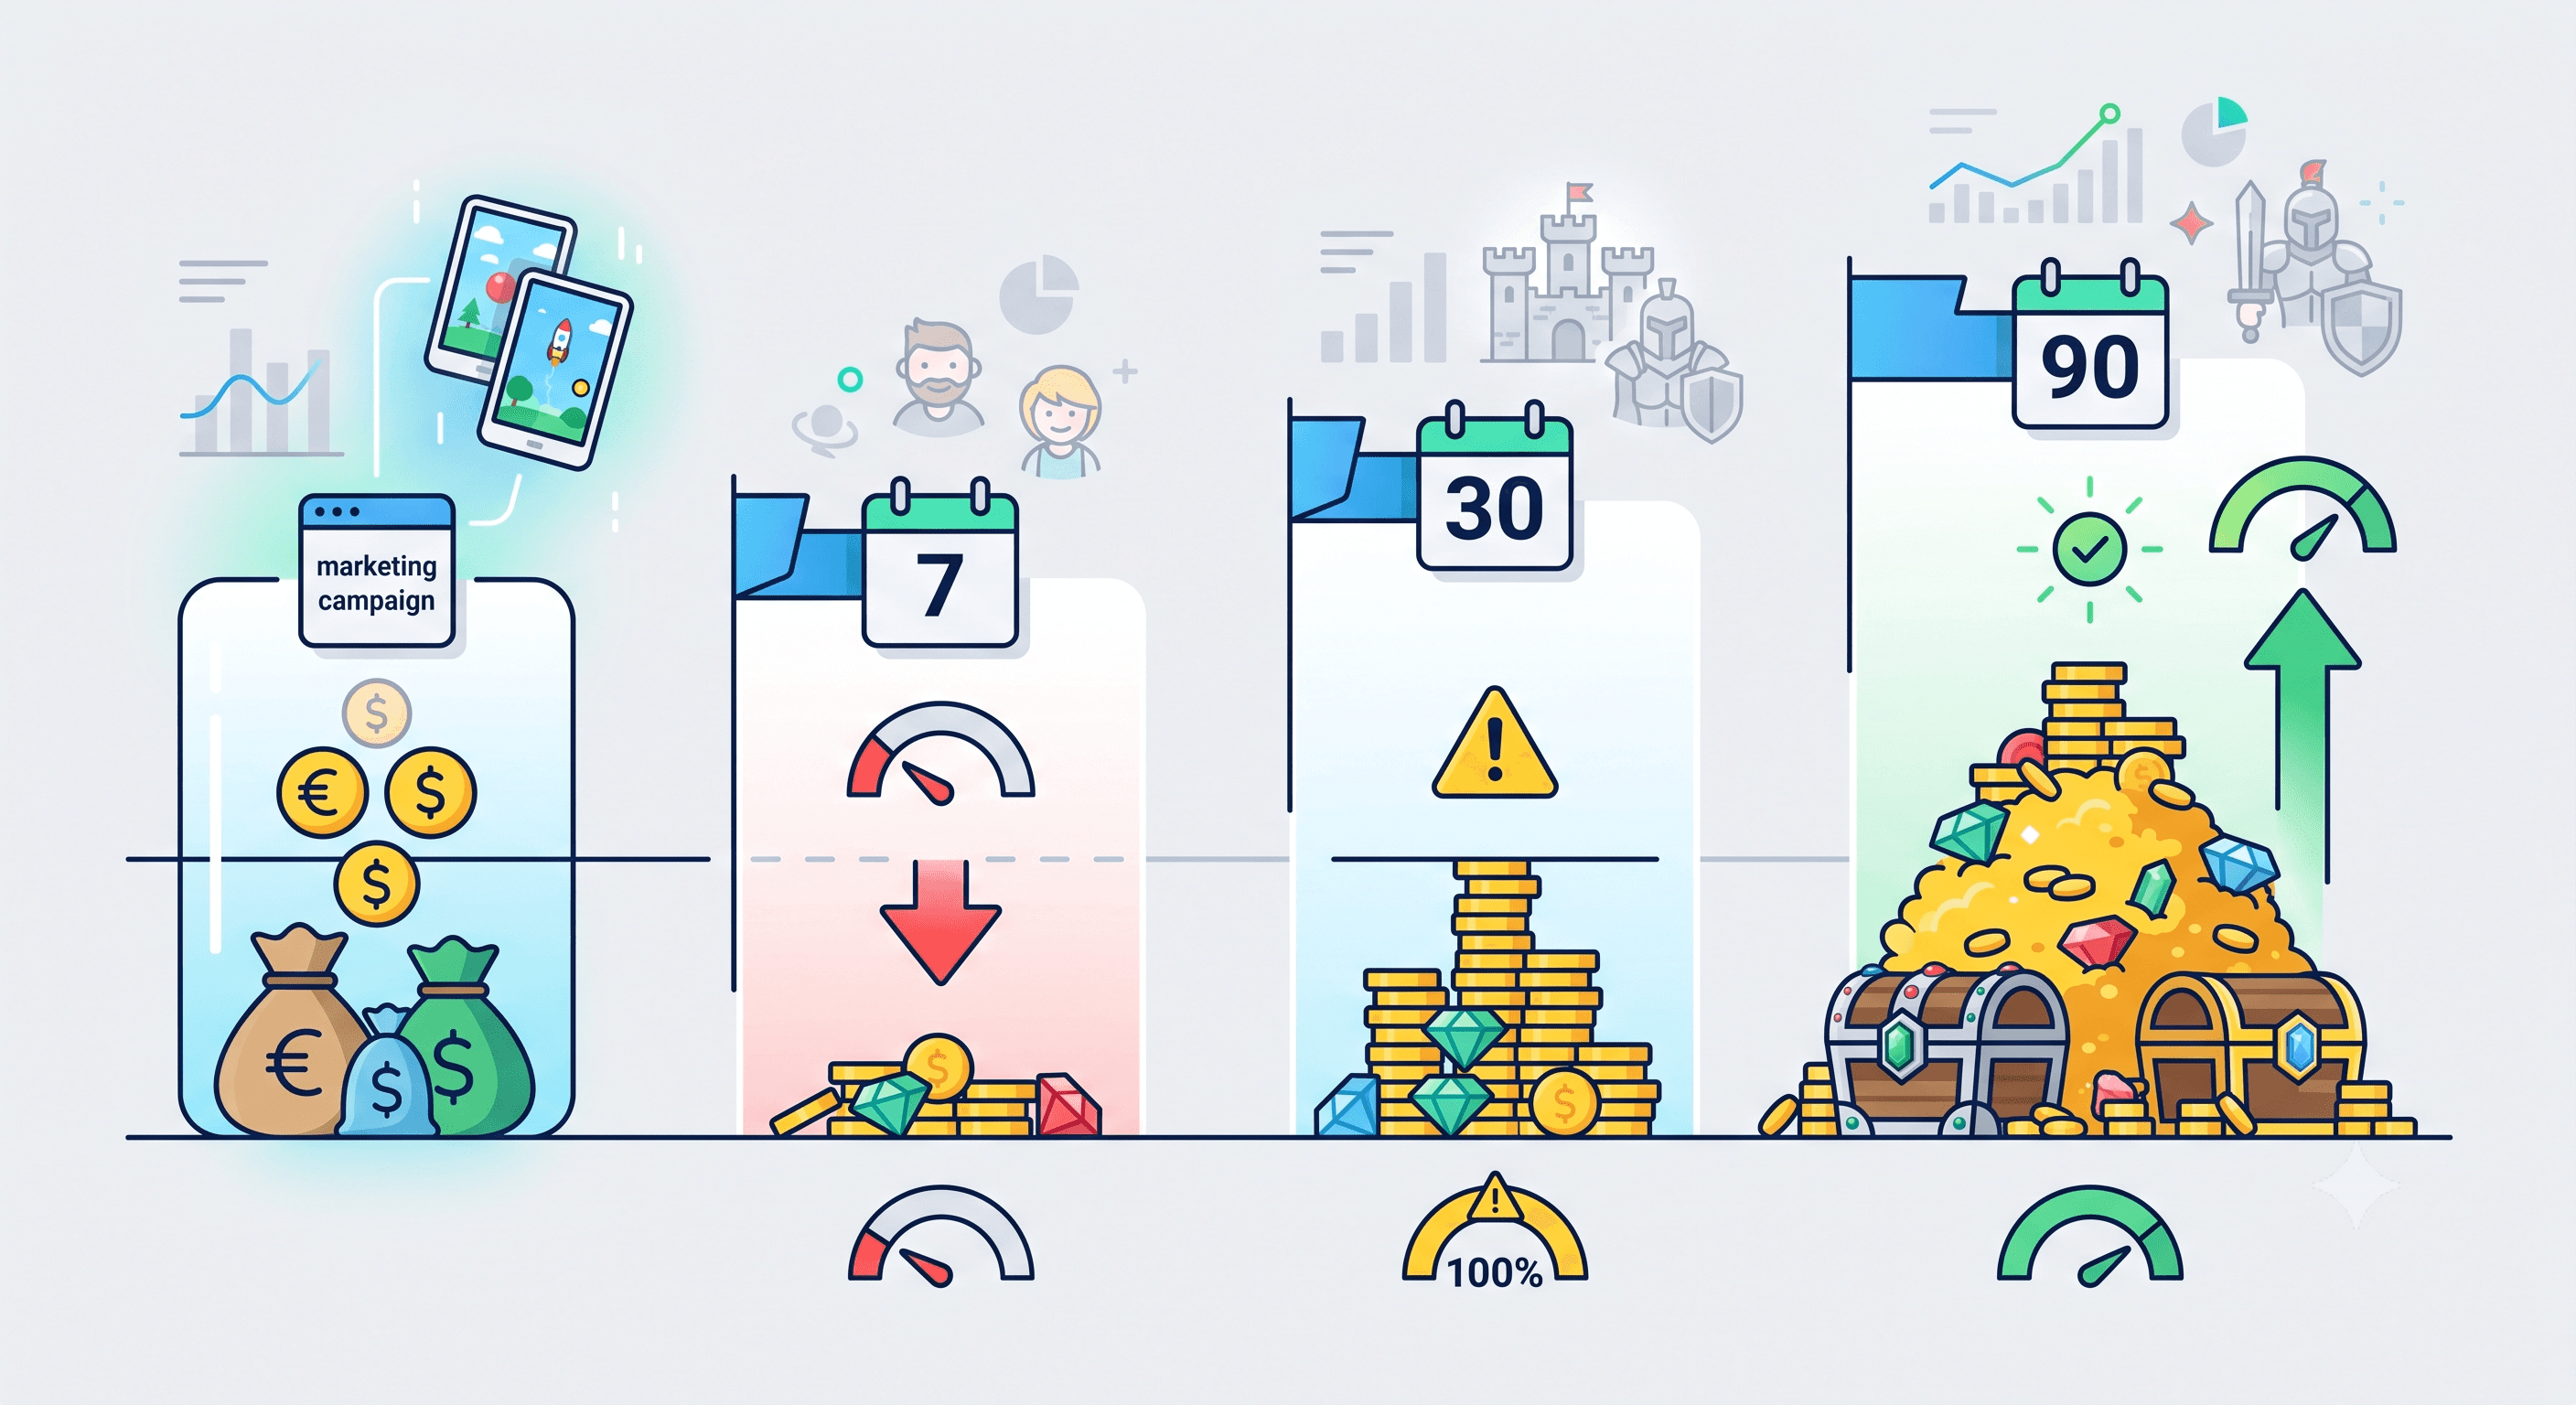
ROAS, or Return on Ad Spend, is the number that tells a mobile game studio whether a user acquisition campaign actually made money. Every UA manager, every founder pitching investors, and every publisher deciding whether to scale a title looks at this metric before anything else, because it's the only one that ties marketing spend directly to revenue.
This guide covers what ROAS actually measures, why a "100%" result isn't the win it sounds like, how the metric plays out differently across genres and channels, and what benchmarks look like heading into 2026.
Key takeaways
ROAS in mobile game analytics is a key metric = Revenue generated divided by ad spend, expressed as a percentage.
100% ROAS means the campaign broke even. It's the line between losing and making money, not something worth celebrating.
Mobile games measure ROAS across windows (D7, D30, D90) instead of as one flat number, because revenue builds up over weeks and months.
Benchmarks vary a lot by genre and monetization model. A casual, ad-monetized game and a mid-core IAP game should never be judged against the same target.
Different UA channels have very different LTV curves, so a channel that looks weak on D7 can end up outperforming on D30 or D60. So make sure to check your channels
What ROAS actually measures?
ROAS answers one question: for every euro or dollar spent on ads, how much money came back.
Spend €1,000 on a campaign and generate €1,000 in revenue from the users it brought in, and the campaign sits at 100% ROAS.
Generate €1,400 and it's at 140%, which is €400 in profit on top of the spend.
Generate €600 and it's at 60%, a €400 loss.
Campaign A | Campaign B | |
|---|---|---|
Spend | €1,000 | €1,000 |
Revenue generated | €600 | €1,400 |
ROAS | 60% | 140% |
Outcome | €400 loss | €400 profit |
For a mobile game, that revenue usually comes from three sources: in-app purchases, in-app ad revenue, and subscriptions where applicable. All of it gets tracked back to the specific ad, network, and campaign that brought the user in, through a mobile measurement partner such as AppsFlyer or Adjust.
Unlike a lot of marketing metrics, this isn't modeled or estimated. It's real revenue tied to the exact ad that drove the install.
Why 100% ROAS is not a win
This is where a lot of people outside performance marketing get tripped up.
100% ROAS sounds complete, sounds like a full result, sounds like success. In reality it just means the campaign spent €1,000 and got exactly €1,000 back. ❌ So nothing was gained.
A campaign needs to sit meaningfully above 100% to be worth running, because that margin also has to cover the team's time, tooling, overhead, and whatever profit the business actually needs to survive. Below 100%, the studio is losing money on every user the campaign brings in. Above 100%, it's making it. There's no in-between reading of that number.
ROAS vs ROI: they are not the same thing
People use these two terms interchangeably all the time, and in UA that mix-up can lead to real confusion in a report or a board meeting. They're related, but they're not measuring the same thing.
ROAS looks only at ad spend versus the revenue that spend generated. It's a media efficiency metric. It doesn't care about salaries, tools, creative production, or anything else the business spends money on. That's actually its strength. It isolates one question: did this specific campaign, on this specific channel, bring back more than it cost.
ROI is broader. It factors in the full cost of running the business around that campaign, not just the media spend. That includes the UA team's time, creative production, tooling and MMP fees, and sometimes overhead. A campaign can post a strong ROAS and still contribute to a weak ROI if the cost of running the operation behind it is high enough.
ROAS | ROI | |
|---|---|---|
What it measures | Revenue from ads vs. ad spend only | Net profit vs. total cost of the effort |
Scope | Media spend only | Media spend plus team, tools, overhead |
Typical use | Day-to-day campaign and channel decisions | Business-level and investor-facing reporting |
Formula | Revenue generated / ad spend | (Revenue - total cost) / total cost |
In practice, most UA teams live in ROAS day to day because it's the number they can act on fastest. A campaign manager can pull ROAS by channel, by creative, even by ad set, and adjust budget the same day. ROI matters more when someone needs to answer a bigger question, like whether the entire UA function is worth what the studio is spending on it, not just whether one campaign paid off.
A studio can also have a campaign sitting comfortably above 100% ROAS and still be running at a loss overall, if the team cost, tooling, and agency fees behind that campaign eat into the margin the ad spend generated. That's the gap ROAS alone will never show.
In this interview, Anton, Founder of Smart Project, explains why his team ignores CPI entirely and optimizes for ROAS

Rethinking UA: What Actually Drives Profitable Growth in Mobile Games with Smart Project
Why timeframe changes everything for ROAS?
ROAS isn't a single static number for mobile games the way it might be in e-commerce, where the purchase and the ad spend happen close together in time. App monetization plays out over weeks and months, so studios track ROAS at fixed windows, most commonly D7, D30, and D90.
Different acquisition channels also carry very different payback curves. Industry reporting on this shows cases where one channel hits a 20% ROAS at D7 but doesn't reach breakeven until D60, while another starts lower on D7 and hits 100% by D30 (Liftoff). Judging every channel against the same D7 target can lead a team to cut a campaign that would have paid off, and scale one that never will.
The practical fix is to build separate D1, D3, D7, D30, and D90 ROAS benchmarks per platform and per channel, instead of applying one blanket target across the board.
ROAS benchmarks by genre (2026 reference points)
These benchmarks should be treated as a general calibration guide.
They vary by genre, monetization model, region, and platform, and a studio's own unit economics should always take priority over an industry average. With that said, published 2025-2026 data gives a useful starting point.
Genre / Model | D7 ROAS | D30 ROAS | Source |
|---|---|---|---|
Casual (iOS) | ~7.6-7.8% | ~47% | Liftoff 2025 Casual Gaming Report |
Casual (Android) | ~7.6-7.8% | ~15% | Liftoff 2025 Casual Gaming Report |
Mid-core (iOS) | ~4.3% | 40%+ considered solid | Liftoff 2025 Casual Gaming Report |
Mid-core (Android) | ~6.1% | n/a | Liftoff 2025 Casual Gaming Report |
Hybrid-monetized mid-core (Android, D90) | n/a | ~1.46x vs 0.93x for IAP-only | Industry aggregate benchmarks, 2026 |
As a general planning reference, a 2:1 to 4:1 overall ROAS (200-400%) is often cited as a healthy long-term target, though this depends heavily on genre and payback window expectations.
On the retention side, which feeds directly into how ROAS develops over time, GameAnalytics' 2025 Mobile Gaming Benchmarks report (based on 11,600 titles across 9 regions) puts median D7 retention across all mobile games at roughly 3.4% to 3.9%, with the top 25% of games reaching 7-8%.
Sensor Tower's State of Mobile Market data for 2026 shows the average D7 retention among the top 25 casual games in December 2025 was closer to 14.9%.
That gap is a good reminder that pooled, all-games benchmarks and top-title benchmarks are measuring two very different populations, and shouldn't be confused with each other.
The ROAS cheat sheet
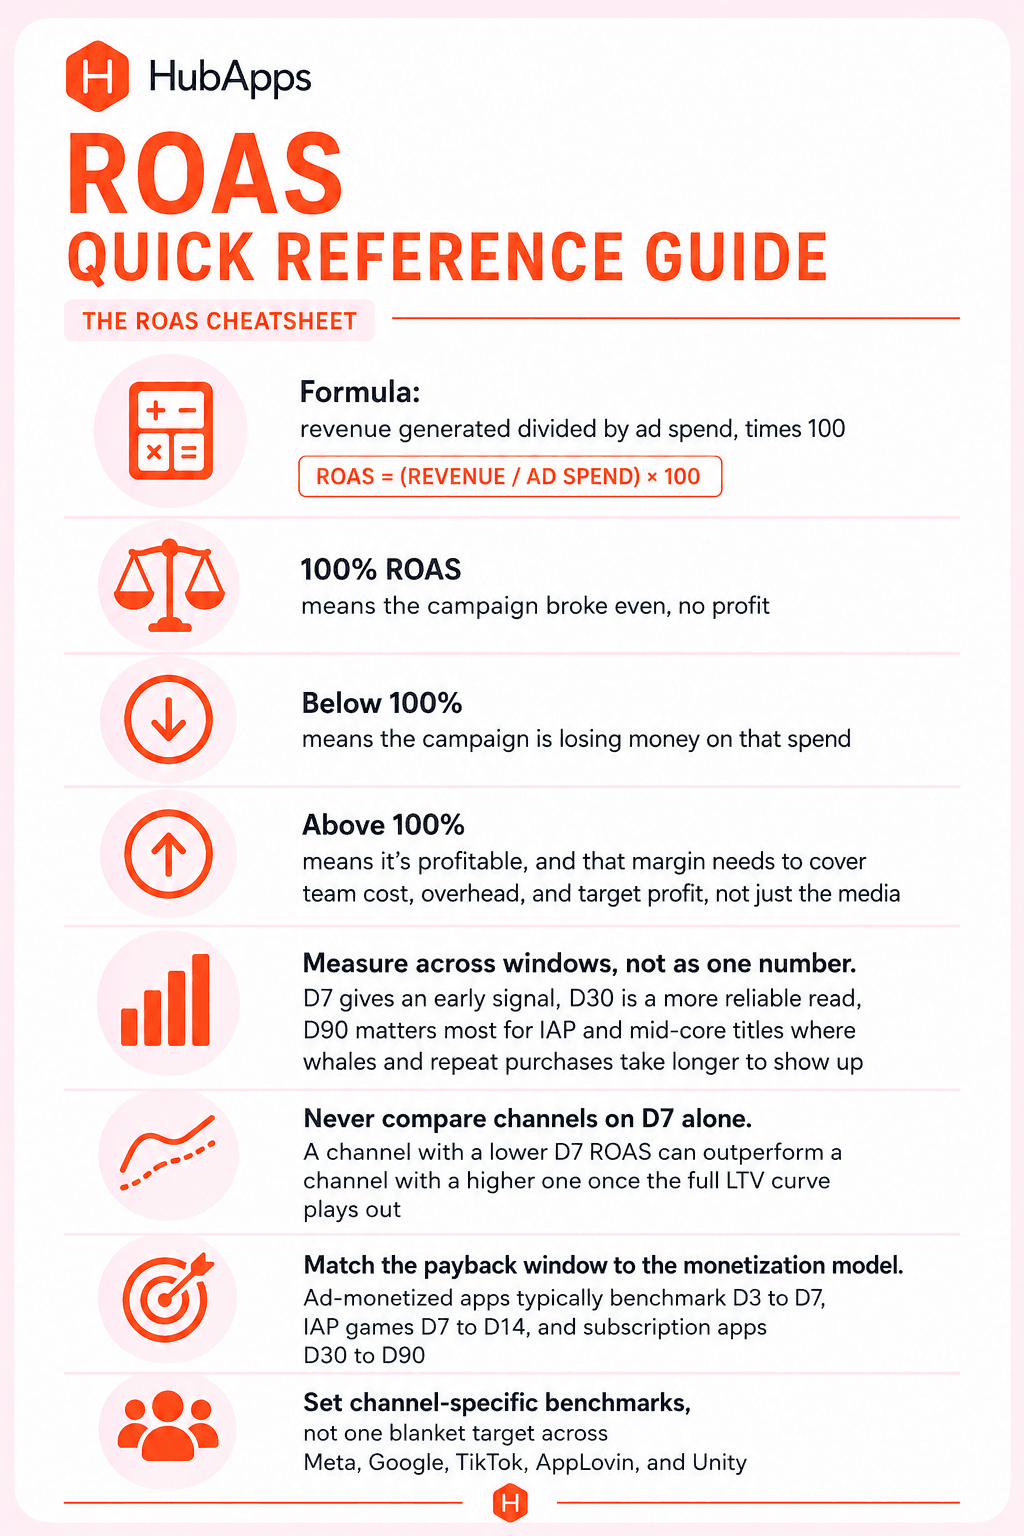
A quick reference for anyone who just needs the shorthand version:
Formula: revenue generated divided by ad spend, times 100
100% ROAS means the campaign broke even, no profit
Below 100% means the campaign is losing money on that spend
Above 100% means it's profitable, and that margin needs to cover team cost, overhead, and target profit, not just the media
Measure across windows, not as one number. D7 gives an early signal, D30 is a more reliable read, D90 matters most for IAP and mid-core titles where whales and repeat purchases take longer to show up
Never compare channels on D7 alone. A channel with a lower D7 ROAS can outperform a channel with a higher one once the full LTV curve plays out
Match the payback window to the monetization model. Ad-monetized apps typically benchmark D3 to D7, IAP games D7 to D14, and subscription apps D30 to D90
Set channel-specific benchmarks, not one blanket target across Meta, Google, TikTok, AppLovin, and Unity
Best practice checklist
☐ Define ROAS windows (D7, D30, D90) before launching a campaign, matched to the game's monetization model (GameAnalytics, Liftoff)
☐ Set separate ROAS benchmarks per UA channel rather than one company-wide target (Liftoff)
☐ Track revenue through a mobile measurement partner (AppsFlyer, Adjust, Singular) so ROAS is tied to real, user-level revenue rather than modeled estimates
☐ Re-evaluate D7-only decisions against D30 and D60 data before cutting a channel
☐ Compare ROAS against genre-specific benchmarks, not pooled, all-games averages (Sensor Tower, GameAnalytics)
☐ Recalculate benchmarks periodically to account for seasonality, new features, and LiveOps activity
FAQs for ROAS in gaming
What is a good ROAS for a mobile game?
It depends entirely on genre, monetization model, and the window being measured. A casual, ad-monetized game might target a D7 ROAS in the 15-25% range and a D30 ROAS of 40-60%. A mid-core or IAP-heavy title often looks weaker at D7 and needs a D90 or D120 window before the number means anything. There's no single "good" ROAS that applies across every game.
Is 100% ROAS good?
No. 100% ROAS means the campaign exactly broke even, so the studio got its ad spend back and nothing more. A profitable campaign needs to sit meaningfully above 100%, since that margin also has to cover team time, tooling, and the business's actual profit target.
How is ROAS different from ROI?
ROAS looks only at ad spend versus the revenue it generated. ROI is a wider measure that includes the full cost of running the campaign, like team time and tooling, not just the media. See the ROAS vs ROI section above for a full breakdown.
Why do different UA channels show different ROAS at the same point in time?
Every channel delivers users with a different monetization curve. A campaign on one network might reach 100% ROAS by day 30, while another reaches the same milestone by day 60 or later. Judging every channel against the same short-term window can lead to cutting a campaign that would have paid off with more time.
What tools track ROAS for mobile games?
Mobile measurement partners like AppsFlyer, Adjust, and Singular are the standard tools for attributing revenue back to the specific campaign, ad, and network that generated it. Analytics platforms like GameAnalytics and Sensor Tower are commonly used alongside them for benchmarking against the broader market.

Mobile gaming UA specialist since 2011. A female pioneer in the industry, Maria has scaled games across every major platform and genre, from indie puzzle games to massive strategy titles. Known for straight talk and results that actually matter.
Share
Related Articles


