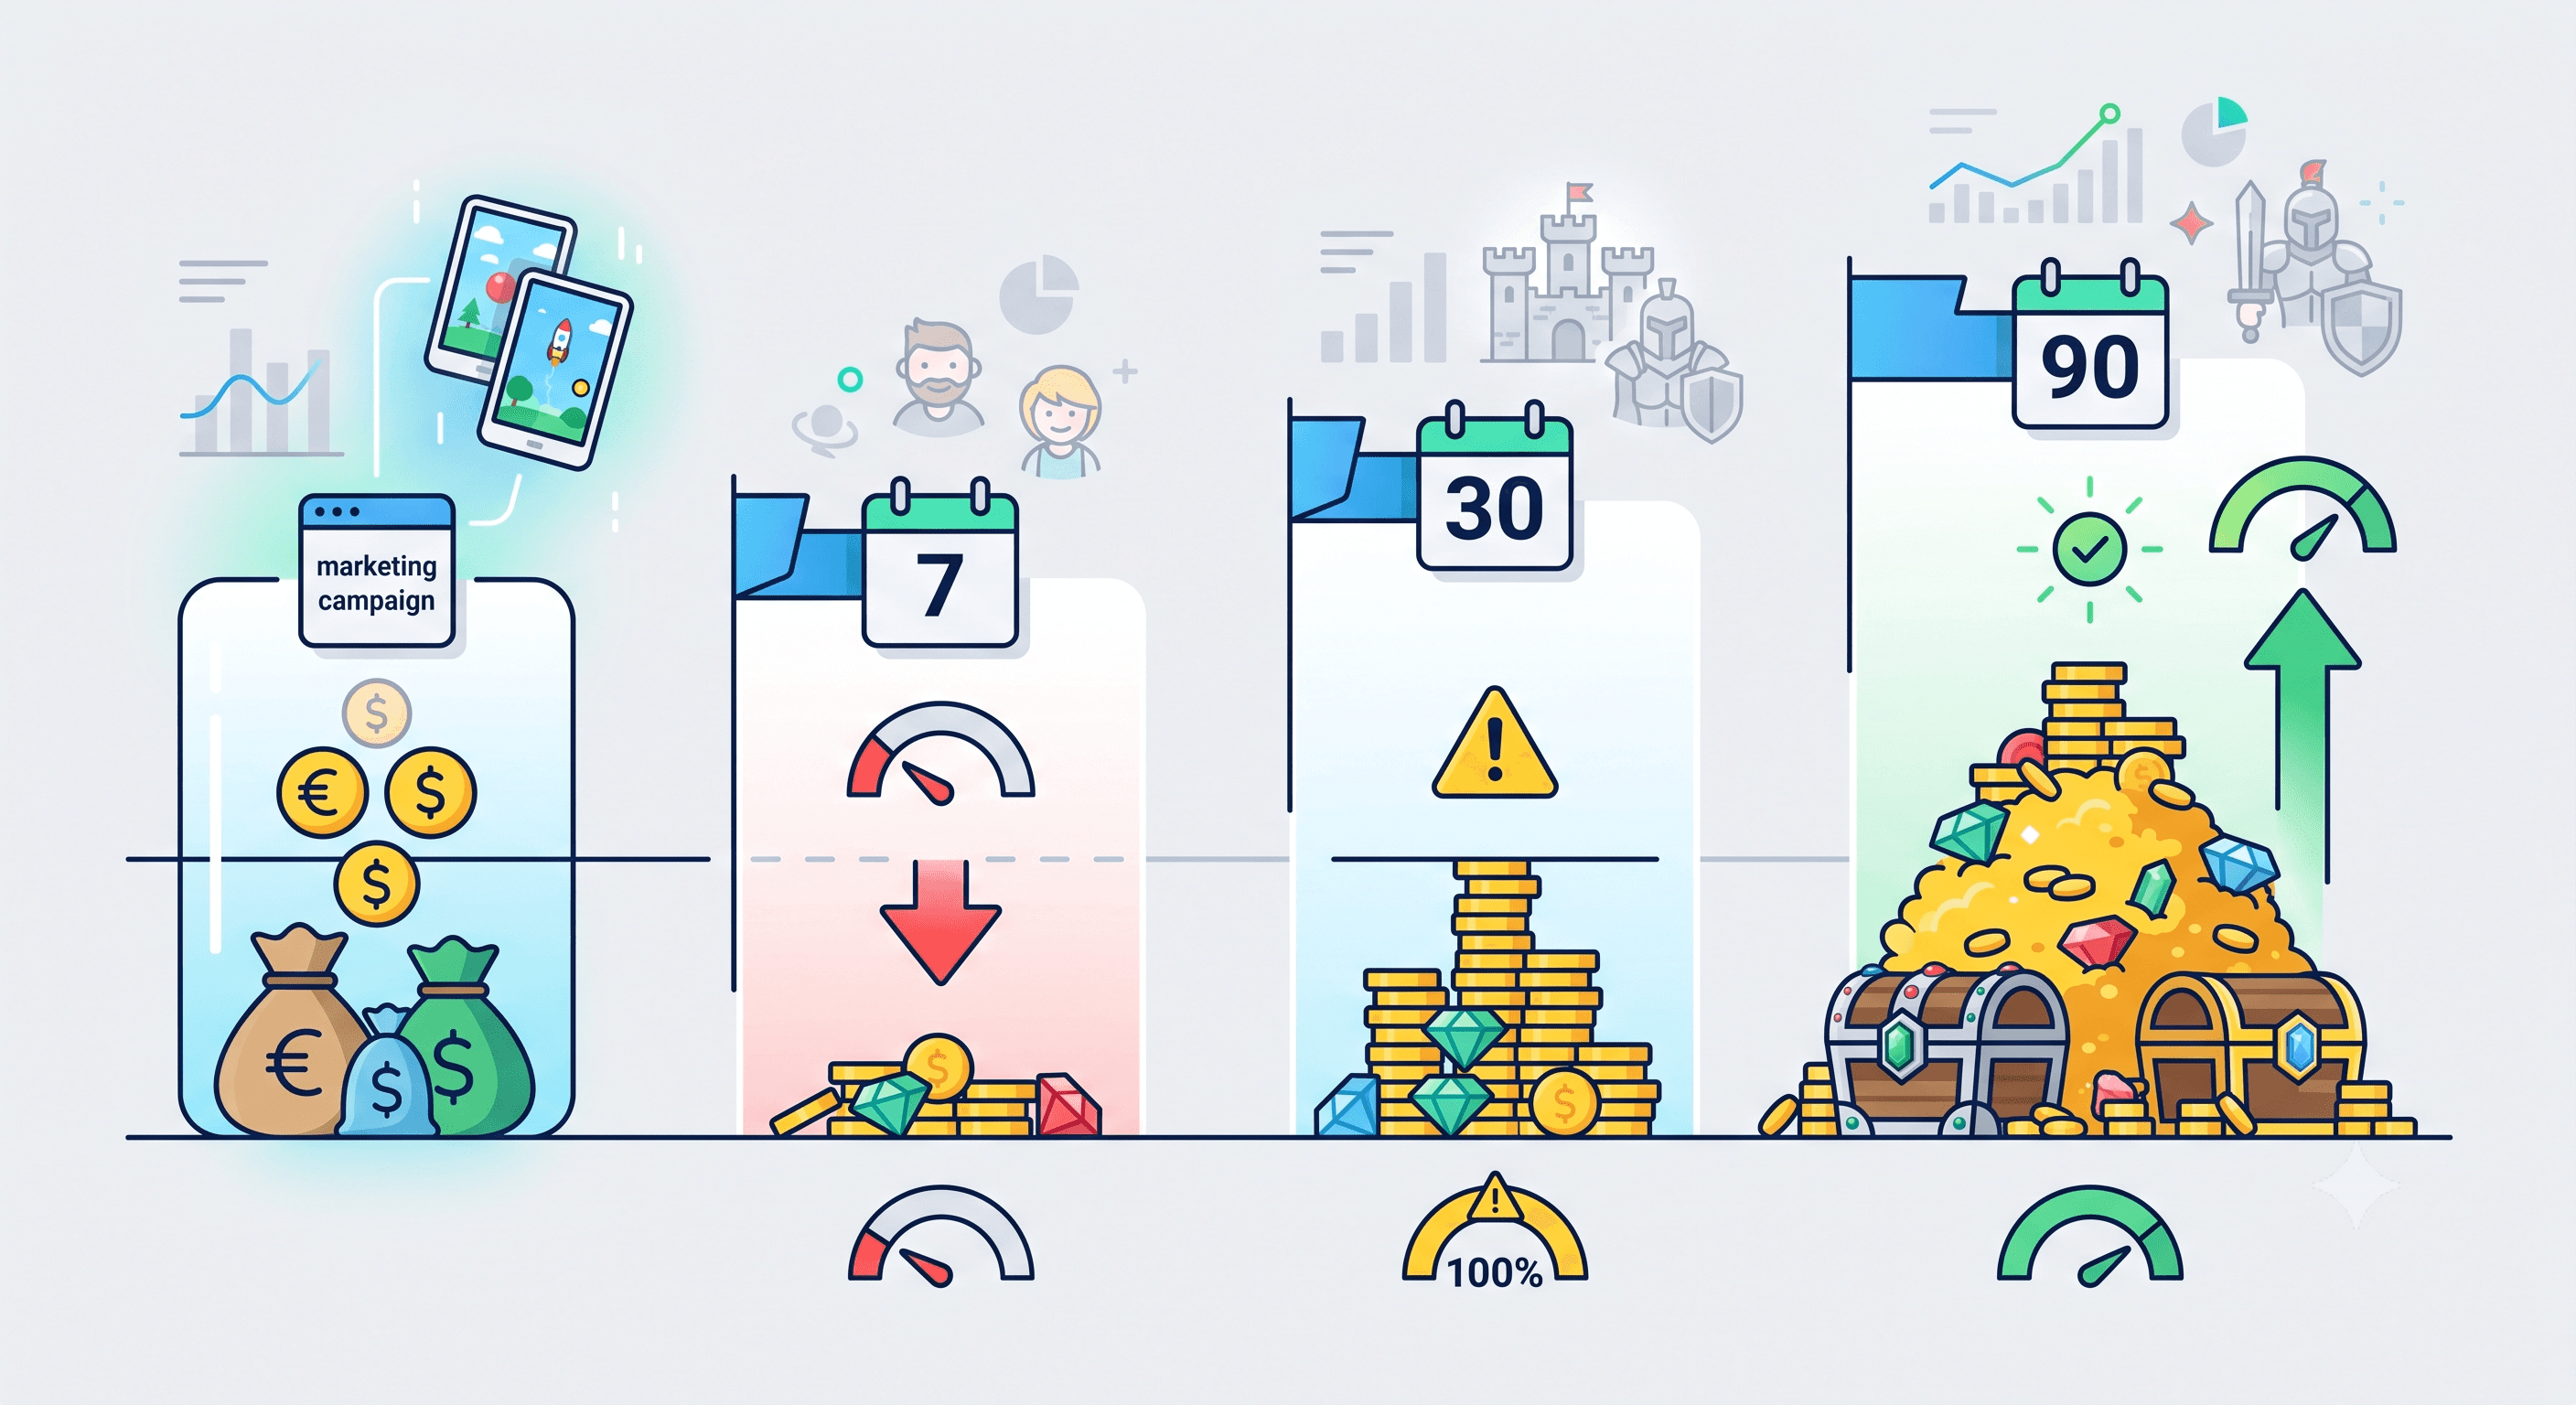
Customer lifetime value (LTV) is one of the most useful metrics for understanding whether your mobile acquisition strategy is actually working. It looks beyond the initial install and asks a more important question: how much revenue does a user generate over the time they remain active?
This matters because users acquired through different channels, campaigns, and creatives can behave very differently after they install.
One cohort might spike revenue in its first few days and then disappear. Another might start slower but keep generating revenue for months. CPI alone can't tell you which of those you're looking at. But LTV can.
Key takeaways
LTV measures total revenue per user over a defined period, not just at the point of install.
A higher CPI campaign can still be the more efficient one if it brings in users with a stronger LTV.
Retention and LTV are related but not the same thing. Good retention doesn't guarantee good LTV if monetization isn't working.
Mobile games generally need cohort-based LTV calculations because revenue isn't spread evenly across users.
Predicted LTV lets UA teams make scaling decisions before Day 90 data is available, but it has to be built on solid early cohort behavior.
What is LTV?
Lifetime value is the total value a user generates over their relationship with your app or game. For mobile analytics, that's usually expressed as revenue per user over a set window, such as D7, D30, or D90, or over the expected lifetime of that user.
Depending on your monetization model, that revenue comes from:
In-app purchases
Advertising (rewarded video, interstitials, banners)
Subscriptions
Other transactions, like one-time unlocks
For example, if a cohort of 10,000 users generates €50,000 in revenue, the observed LTV for that cohort is €5 per user. That number isn't final. If those users keep spending or watching ads, LTV keeps climbing. This is why you'll see LTV reported at specific checkpoints like D7 LTV, D30 LTV, or D90 LTV rather than as one fixed figure.
LTV vs. ARPU vs. ARPPU: what's the difference?
These three metrics get mixed up constantly, so it's worth being precise.
Metric | What it measures | When it's useful |
LTV (Lifetime Value) | Total revenue generated by a user over a defined period or their full lifetime in the app | Evaluating whether acquisition spend is justified over time |
ARPU (Average Revenue Per User) | Total revenue divided by all active users, including non-payers | Tracking overall monetization health across your whole user base |
ARPPU (Average Revenue Per Paying User) | Total revenue divided only by users who made a purchase | Understanding how much your payers specifically are worth |
ARPU and ARPPU are usually daily or monthly snapshots. LTV is cumulative and tracks a cohort over time. If your ARPU is flat but your LTV is climbing, that's often a sign your existing users are becoming more valuable even if new user volume hasn't grown.
How to calculate LTV?
The simplest version of the formula is:
LTV = Average Revenue Per User × Average User Lifespan
In practice, mobile games rarely use this simple version because revenue isn't distributed evenly across users. A small percentage of payers can generate the majority of revenue, and a large share of users may never pay at all. Because of that, most teams calculate LTV on a cohort basis instead: group users by install date, channel, or campaign, then track how much revenue that specific group generates over time.
A common cohort-based approach:
Cohort LTV (day X) = Cumulative revenue from cohort up to day X ÷ Number of users in cohort
This gets recalculated as more data comes in, which is why you'll often see LTV curves rather than a single static number.
Why LTV varies between users
Not all users are worth the same, and that's expected. A few of the main drivers:
Channel. Users from paid social behave differently than users from organic search or app store browse.
Country. Tier 1 markets typically produce higher LTV than Tier 3 markets, but also come with higher CPI.
Platform. iOS users often show stronger monetization than Android users in the same game, though CPI on iOS is usually higher too.
Creative. The ad that brought someone in shapes their expectations, which affects how they behave once they're in the game.
Cohort timing. A cohort acquired during a UA campaign optimized for volume will often look different than one acquired during a campaign optimized for value-based bidding.
This is part of why UA teams have shifted toward more precise targeting focused on users with higher retention and stronger LTV rather than broad acquisition, particularly on iOS, according to Business of Apps' 2025 mobile gaming report. Chasing installs at any cost stopped being the dominant strategy a while ago.
What is the difference between Retention and LTV?
Retention and LTV are closely related, but they measure different things. Retention tells you how long users keep coming back. LTV tells you how much revenue those users generate while they're coming back.
Good retention is usually a prerequisite for good LTV, since a user has to keep opening the app to keep generating revenue. But retention alone doesn't guarantee anything. You can have a game with excellent D7 retention and still have weak LTV if the monetization model isn't converting engagement into revenue.
Monetization and LTV
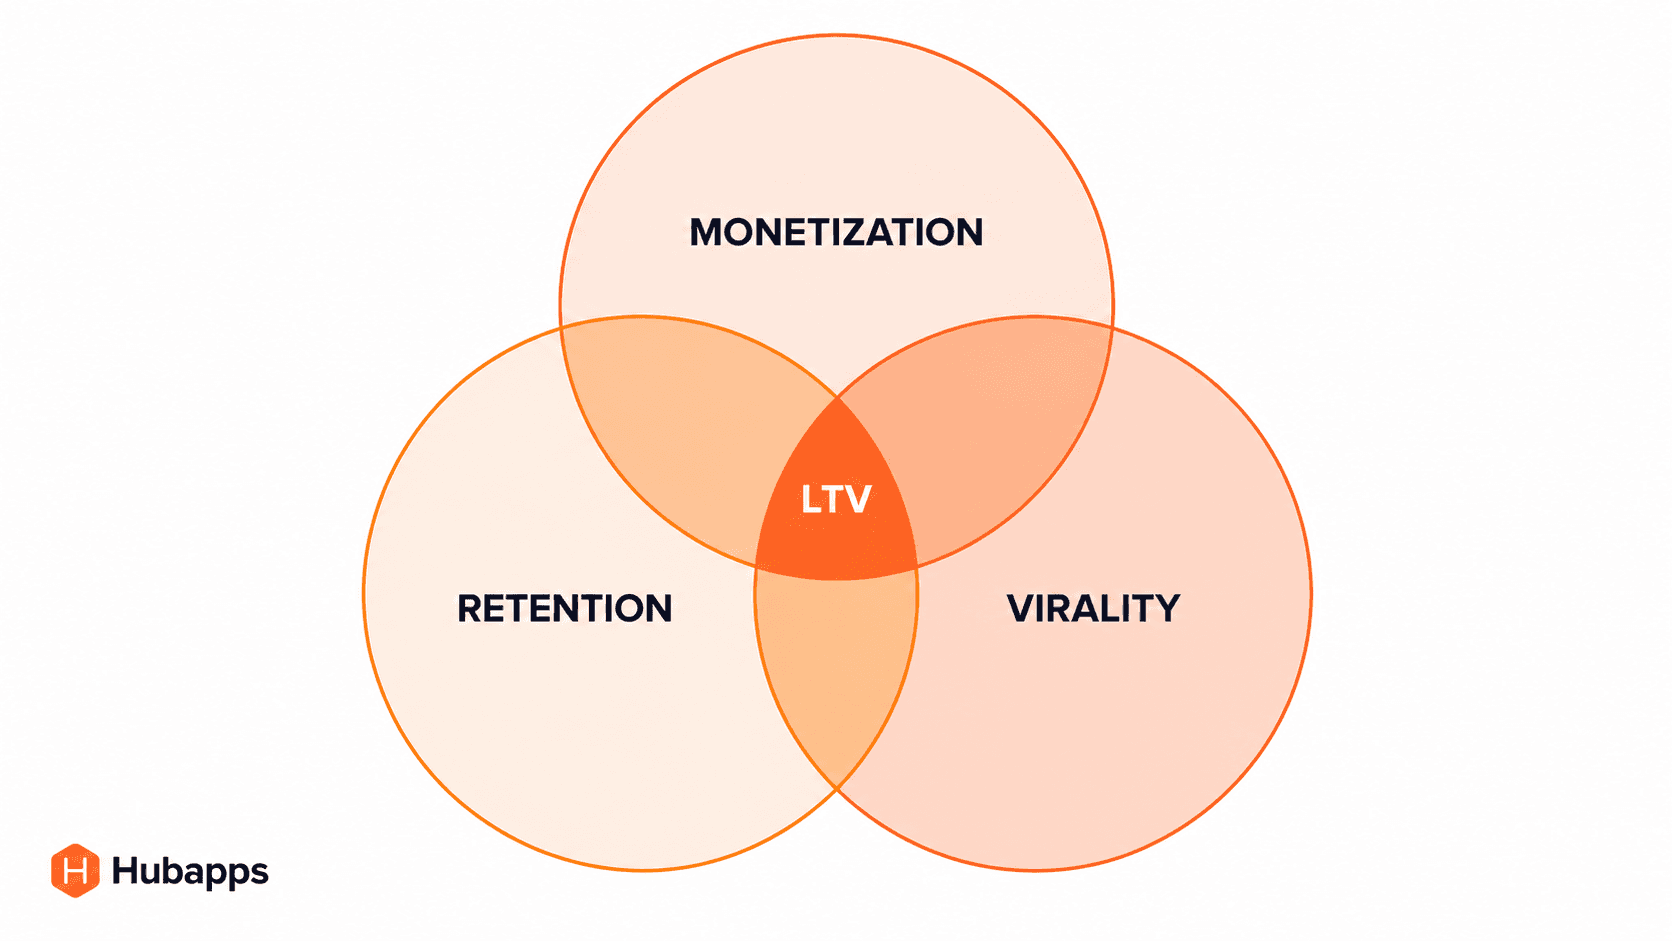
How you monetize shapes how your LTV curve looks.
In-app purchases (IAP) tend to produce LTV that's concentrated in a small percentage of payers. A hybrid-casual or mid-core game might see the top 5% of spenders generate the majority of total revenue.
Advertising (IAA) spreads revenue more evenly across the user base, since almost every active user generates some ad revenue just by playing. This tends to produce a flatter, more predictable LTV curve, but with a lower ceiling per user compared to strong IAP monetization.
Subscriptions produce a different shape entirely, with revenue recognized on a recurring basis rather than tied to individual transactions, which makes churn the number that matters most.
Hybrid models, combining IAP and IAA, have become the dominant monetization approach across casual and hybrid-casual games in 2025 and 2026, per Liftoff and other industry benchmark reports, and generally produce the most resilient LTV since revenue isn't dependent on a single source.
How to Predict LTV?
You can't wait until Day 90 to decide whether a campaign is worth scaling. By the time you have full observed LTV, you may have already overspent or missed the window to scale a winning campaign. This is why UA teams rely on predicted LTV instead.
Observed LTV is exactly what it sounds like: actual revenue collected from a cohort up to a specific point. It's accurate, but it's backward-looking.
Predicted LTV uses early cohort behavior (D1, D3, or D7 revenue and engagement patterns) along with historical data from similar cohorts to estimate what a user's full lifetime value will be. The earlier the prediction point, the less accurate it tends to be, but even a rough D7-based prediction is usually enough to make a go or no-go call on scaling a campaign.
The reliability of predicted LTV depends heavily on having enough historical data to model against. A brand-new game with no prior cohorts to compare to will have much less reliable predictions than an established title with years of cohort data behind it.
Using LTV in UA decisions
This is where LTV earns its keep. On their own, CPI, CAC, and ROAS only tell part of the story. Put together with LTV, they tell you whether a campaign is actually worth running.
CPI (Cost Per Install) tells you what you paid to acquire a user, nothing more.
CAC (Customer Acquisition Cost) is a broader version of CPI that can include total marketing spend, not just media cost.
ROAS (Return on Ad Spend) compares revenue generated against spend, usually reported at set checkpoints like D7 or D30 ROAS.
Payback period is how long it takes for a cohort's LTV to cover its acquisition cost.
Allowable acquisition cost is the maximum you can afford to pay per user while still being profitable, based on predicted LTV.
LTV Matters more than CPI

LTV vs CPI: a winning strategy for mobile
Here's why looking at CPI alone is misleading.
Imagine Campaign A has a €2 CPI and a D90 LTV of €3. Campaign B has a €3.50 CPI and a D90 LTV of €8. Looking only at acquisition cost, Campaign A looks cheaper and more efficient. Once you look at value generated, Campaign B is the stronger campaign by a wide margin.
This isn't a hypothetical gap either. Liftoff's 2025 Casual Gaming Apps Report shows CPI can swing by more than 4x between genres on the same platform, with casino games on iOS averaging around $21 CPI compared to roughly $4.29 for RPGs on Android.
A campaign that looks expensive in isolation can still be the right one to scale if the LTV justifies it, and a cheap CPI campaign can quietly be losing money if the users it brings in don't stick around or spend.
Diagnosing low LTV
When LTV comes in lower than expected, the fix depends on where the problem actually sits.
Symptom | Likely cause | Where to look |
Low retention | Weak onboarding, unclear early gameplay, poor progression pacing | Onboarding flow, first session experience, tutorial drop-off |
Good retention, low LTV | Retention isn't the issue, monetization is | IAP pricing and placement, ad frequency and eCPMs, offer timing |
Good LTV, but acquisition cost too high | The users are valuable, but you're paying too much to get them | Targeting, creative quality, channel mix, bidding strategy |
LTV varies significantly by source | Different cohorts are behaving differently and getting averaged together | Break out LTV by channel, campaign, and creative rather than looking at a blended number |
Most low-LTV problems get misdiagnosed because teams look at a single blended number instead of segmenting it. A game with strong LTV from one channel and weak LTV from another will show an unremarkable average that hides both stories.
Conclusion
LTV gives UA teams a way to connect acquisition with the wider economics of the product. It doesn't replace CPI, retention, or ROAS. It puts those metrics into context.
The most useful LTV analysis isn't just knowing the average value of a user. It's understanding which users have the highest value, why they have it, and whether you can acquire more of them at a sustainable cost.
Frequently asked questions
How is LTV different from ROAS?
ROAS compares revenue to spend as a ratio, usually at a fixed checkpoint. LTV is the actual revenue figure per user, independent of what you spent to acquire them. You need LTV to calculate ROAS, but they answer different questions. ROAS tells you about efficiency; LTV tells you about value.
What's a good LTV for a mobile game?
There's no universal number. It depends entirely on your genre, monetization model, and market. A hyper-casual game with a €0.50 LTV can be highly profitable if CPI is low enough, while a mid-core RPG needs a much higher LTV to justify its typically higher CPI. Compare your LTV against your own CPI and payback period targets rather than an industry average.
How long should I wait before trusting my LTV numbers?
Early LTV, especially anything under D7, should be treated as directional, not final. The more mature your predictive model and the more historical cohort data you have, the earlier you can trust an estimate. Without that history, give it at least D30 before making major scaling decisions.
Can retention be strong while LTV is weak?
Yes, and it's more common than people expect. Users can keep opening the app without ever converting to a paying action or generating meaningful ad revenue. If you see this pattern, the problem is almost always in monetization, not in the product experience keeping people around.

Mobile gaming UA specialist since 2011. A female pioneer in the industry, Maria has scaled games across every major platform and genre, from indie puzzle games to massive strategy titles. Known for straight talk and results that actually matter.
Share
Related Articles